library(tidyverse)

mtcars <- as_tibble(datasets::mtcars)Horizontal bar chart
To have horizontal bar charts ordered by frequency, I have used geom_bar() and coord_flip for a long time.
I have now learned in an example that this is not necessary.
Here are a few examples and the code for future references.
ggplot(mtcars, aes(x = cyl)) +
  geom_bar(fill = "lightgreen")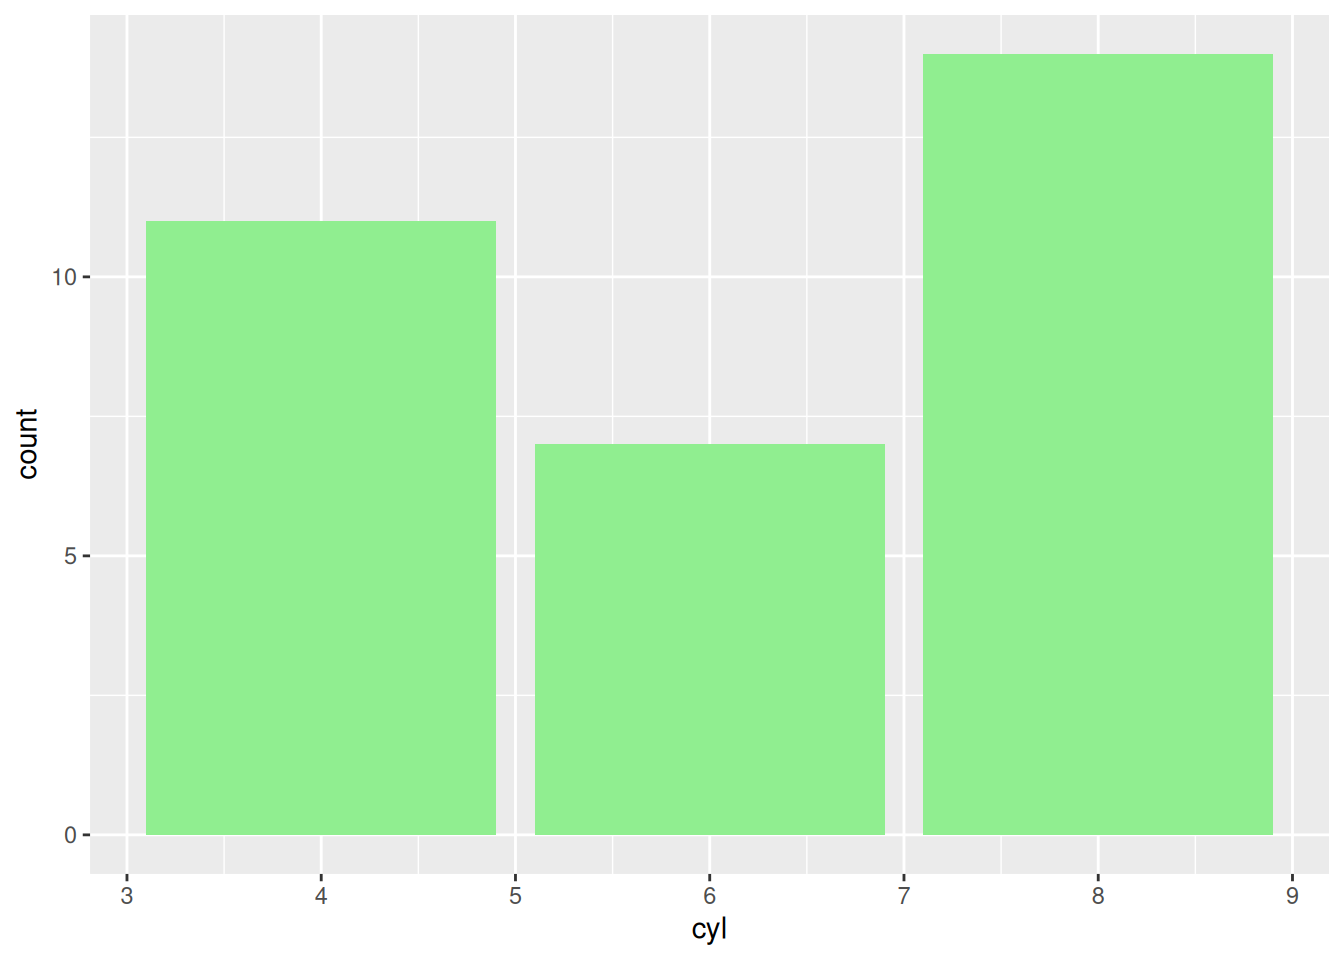
I used to do some pre-processing to prepare data for the plot.
pl_dt <-
  mtcars |>
  mutate(cyl = fct_infreq(factor(cyl)) |> fct_rev())
For the figure, I used coord_flip.
ggplot(pl_dt, aes(cyl)) +
  geom_bar(fill = "grey") +
  coord_flip()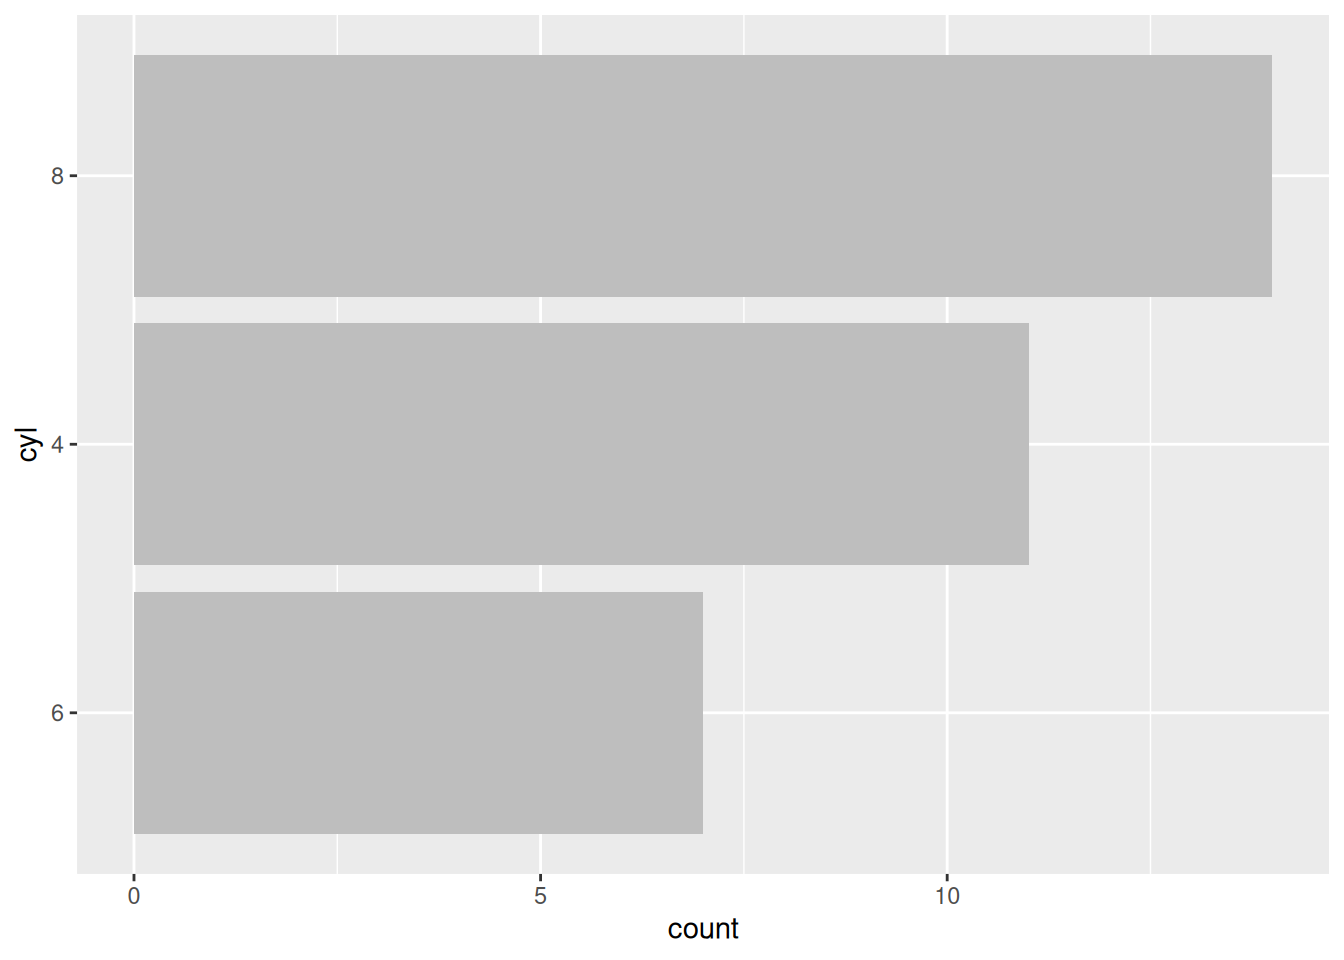
That was not necessary, as I have learned now.
ggplot(pl_dt, aes(y = cyl)) +
  geom_bar(fill = "lightblue")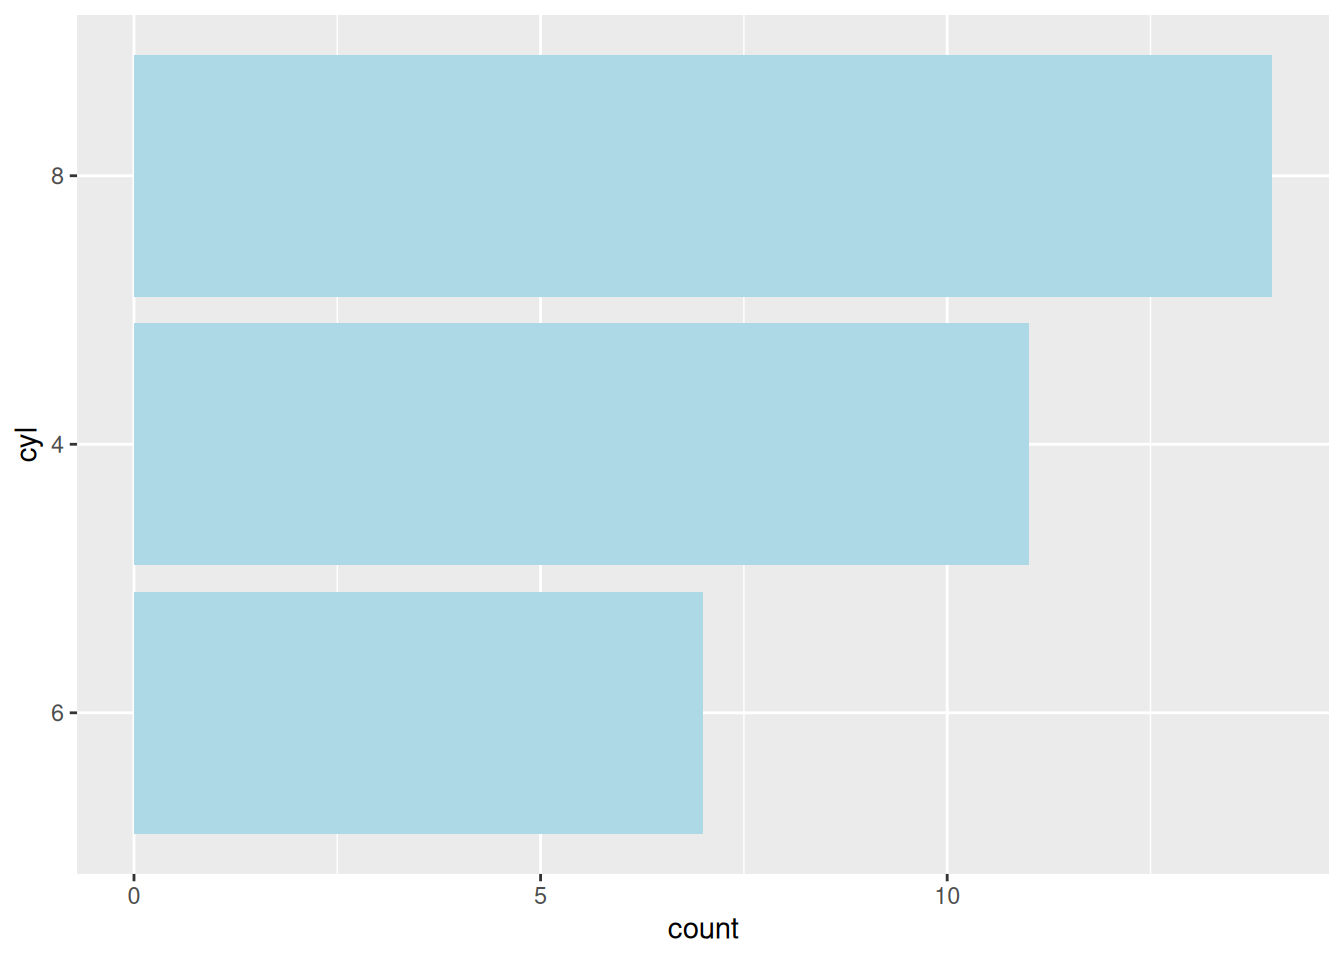
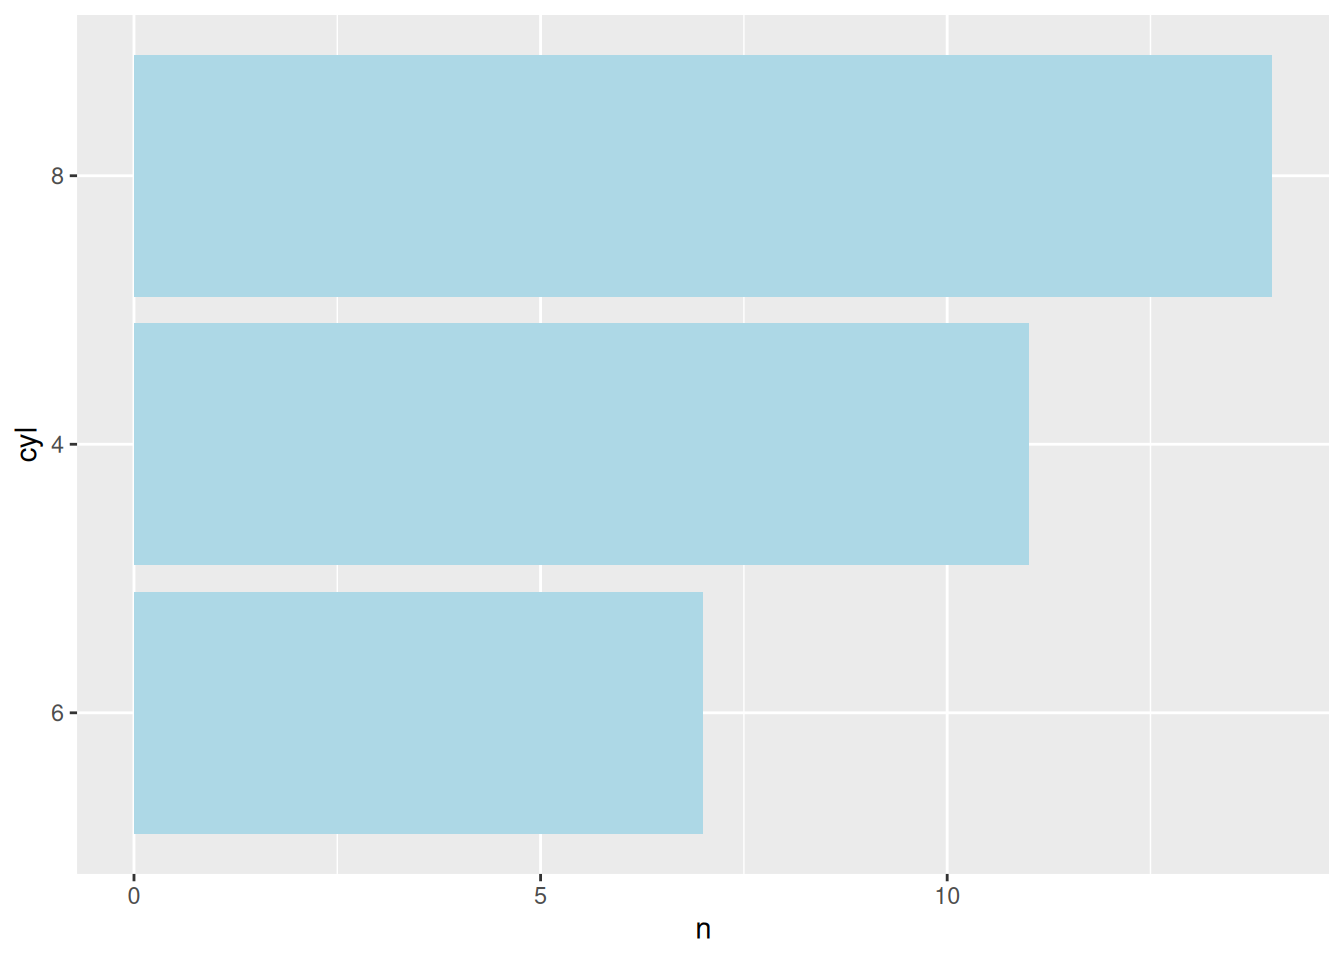
Here is an alternative approach with geom_col().
pl_dt <-
  mtcars |>
  count(cyl) |>
  mutate(cyl = fct_reorder(factor(cyl), n))

ggplot(pl_dt, aes(x = n, y = cyl)) +
  geom_col(fill = "lightblue")